Calculating CO2 Emissions
The ARKRAY Group has been working to minimize the environmental impact stemming from its business activities by quantitatively identifying and analyzing the kinds of resources and energy it uses, along with their impact on the environment.
Notes:
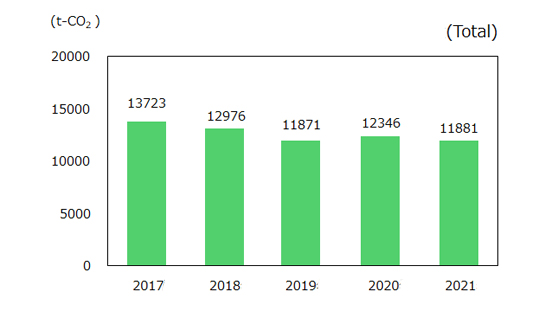
- This graph includes measurement data for eight business locations (major development bases and production sites).
- Our company fiscal year runs from November through October of the following year (e.g. FY2020 = 11/1/2020-10/31/2021)
We started by investigating the energy consumed at each base/site, such as electricity and gas, then calculated which CO2 emissions fell under Scope 1 (direct emissions) and Scope 2 (indirect emissions from energy sources).
CO2 emissions decreased sharply in FY2019 due to the spread of COVID-19.
Despite an increase in CO2 emissions in FY2020 compared to the previous year, as production activities resumed, emissions are declining compared to pre-pandemic levels.
Our next step will be to calculate the emissions of the entire supply chain, including Scope 3 (other indirect emissions).
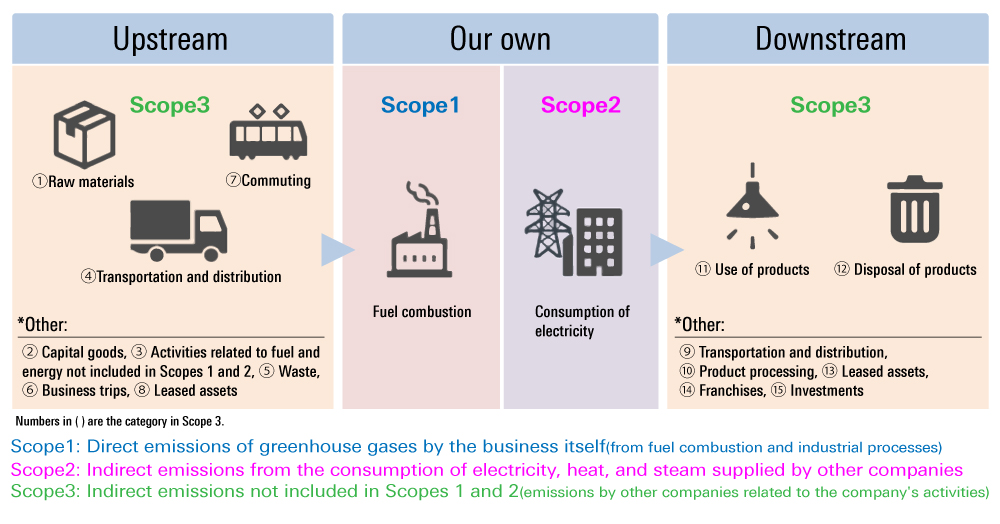
Source: “Green Value Chain Platform” from the Japanese Ministry of the Environment